Wait for an analyst
A simple question joins the queue, and every follow-up joins it again.
AI business intelligence
Connect a database, CRM, spreadsheet or CSV. BI Bee builds the dashboard and answers your questions in plain English. Every number comes from your data, with the working shown.
Sales dashboard · This month · All markets
Built from your columns
What changed · vs last month
| Last mo. | AED 1.24M |
|---|---|
| Dune | AED 21.1K |
| Pearl | AED 2.9K |
| Oasis | −AED 9.9K |
| Falcon | AED 8.4K |
| Marina | AED 16.9K |
| This mo. | AED 1.28M |
Revenue against target · this month
97% of target reached
3 of 5 brands below target
Customer value
The top 1% of customers bring 15% of revenue.
Which brands are below target?
Worked out from 48,210 rows · revenue, target
Not listed? Upload a CSV export or use the REST connector for any JSON API today.
Why BI Bee
Most teams get their numbers in one of three ways. Each one costs time or trust.
A simple question joins the queue, and every follow-up joins it again.
Setup, modelling and training come before anyone gets a useful chart.
Fast, but your data leaves your hands and its numbers are hard to check.
Connect your data once. The dashboard is built for you, questions get plain-English answers, and every number comes from your data.
Start free trialHow it works
01Any source
Orders in a database, contacts in a CRM, targets in a spreadsheet. Connect each one, or upload a CSV, and it lands in your private workspace.
Three sources · three datasets
orders48,210contacts9,860targets24002Checked on arrival
BI Bee reads each column's type and how complete it is, finds the dates and amounts, and marks emails and phone numbers as personal before anyone builds a chart.
Retail sample · 13 columns
customer_id · Textcustomer_email · Text · personalrevenue · Numberorders · Number03Built for you
KPIs, trends and breakdowns are picked from your columns. When the data allows, BI Bee adds funnels, cohorts, segments and what changed.
Revenue · this month
AED 1.28M
04Ask anything
Ask in plain English. The answer shows the rows, fields and filters behind it, and one more message turns it into a chart.
How did revenue do over the last six weeks?
AED 498K last week, +9% on the week before.
Sample data for fictional brands.
The real app
Screenshots of the product itself, taken with a sample dataset of fictional brands.
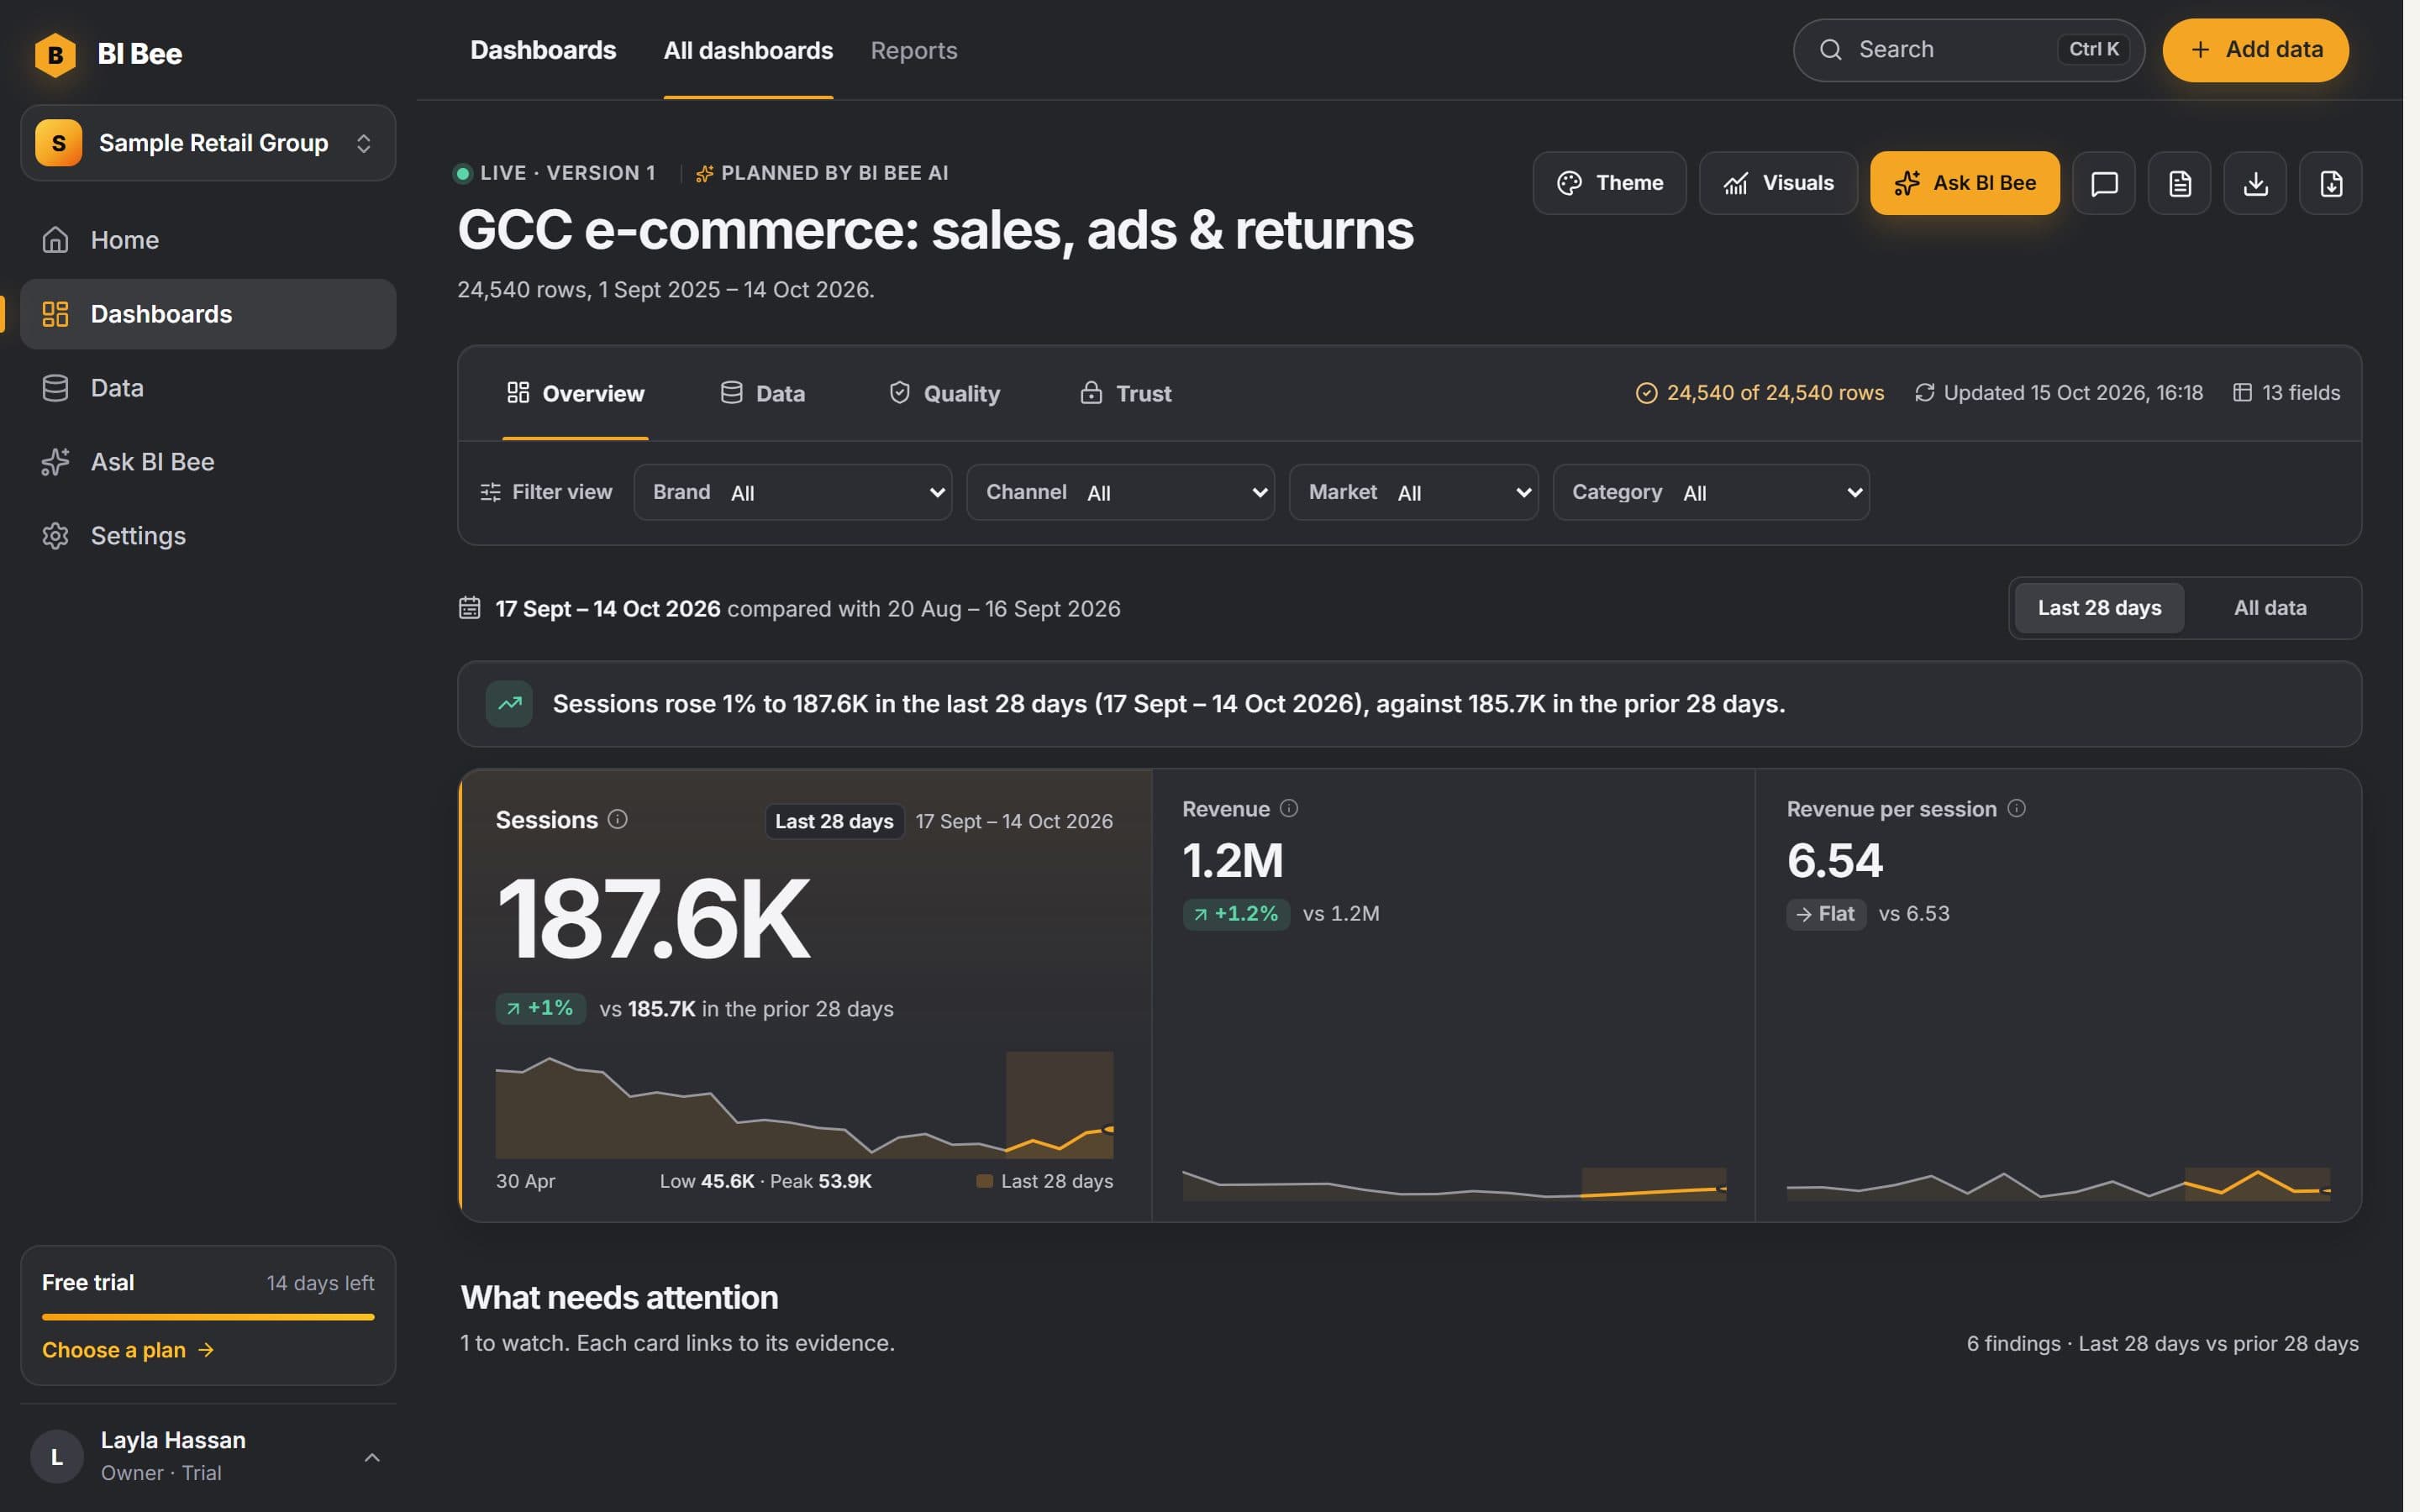
Swipe the screenshot to see the full screen.
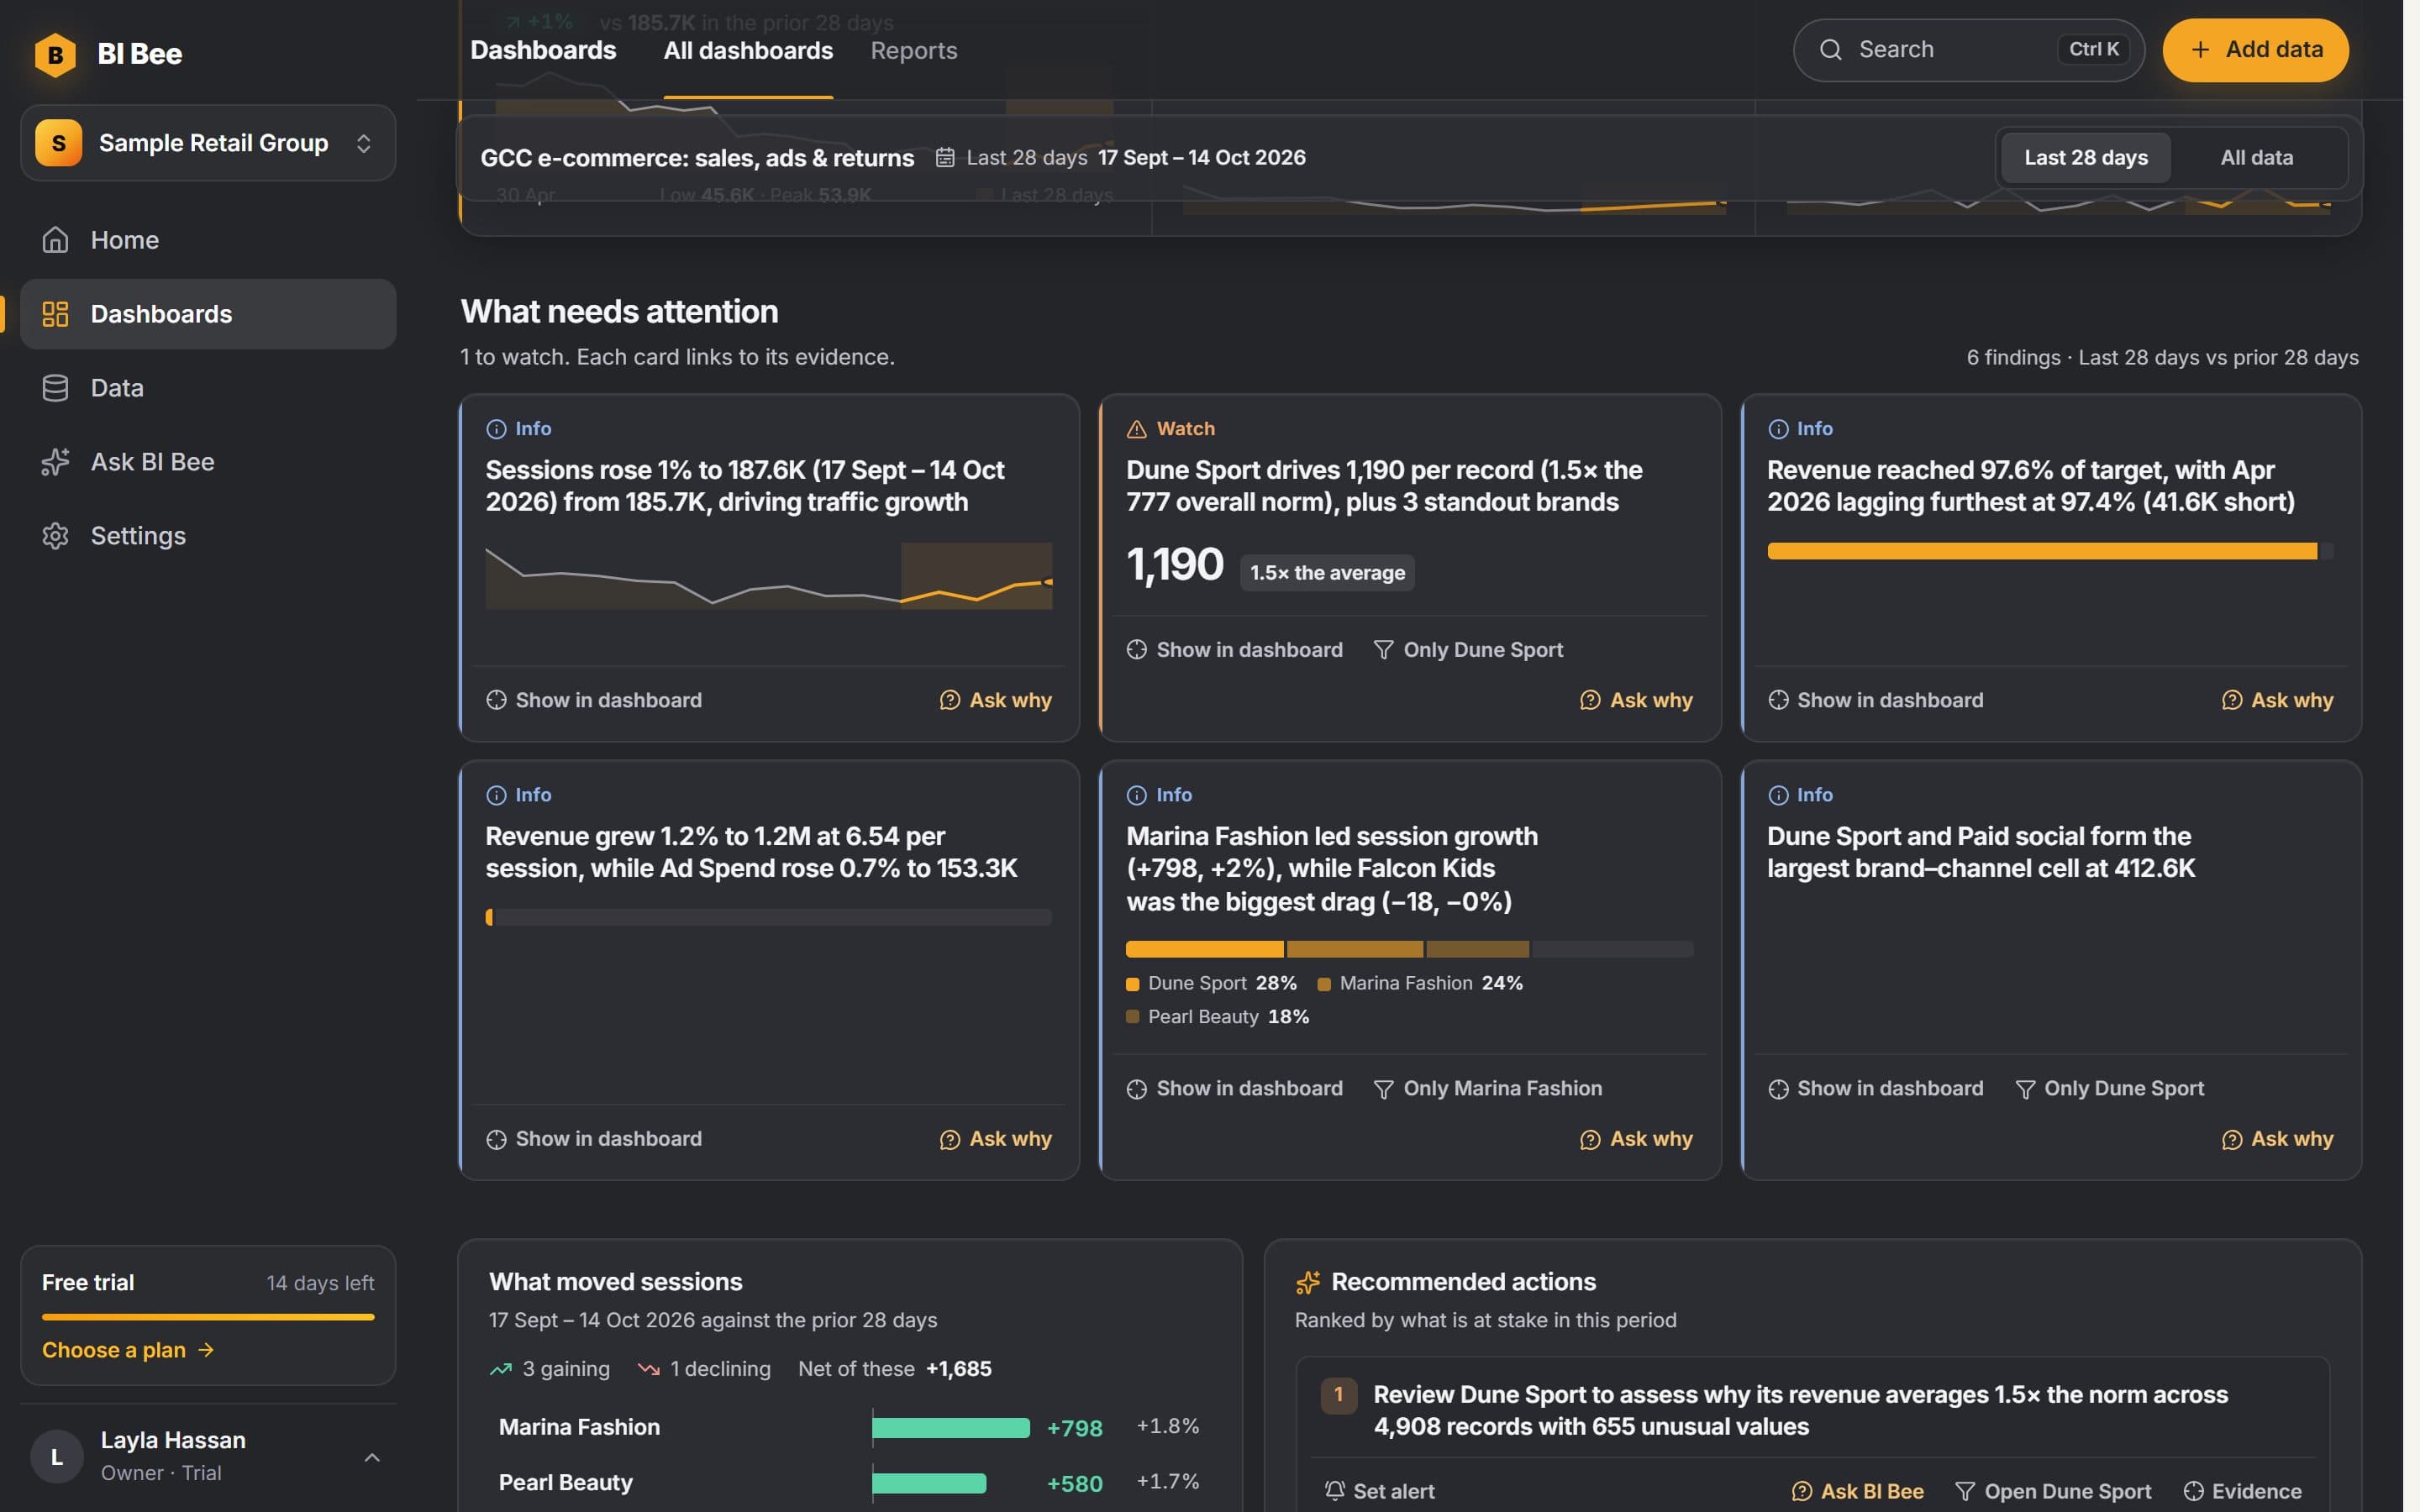
Swipe the screenshot to see the full screen.
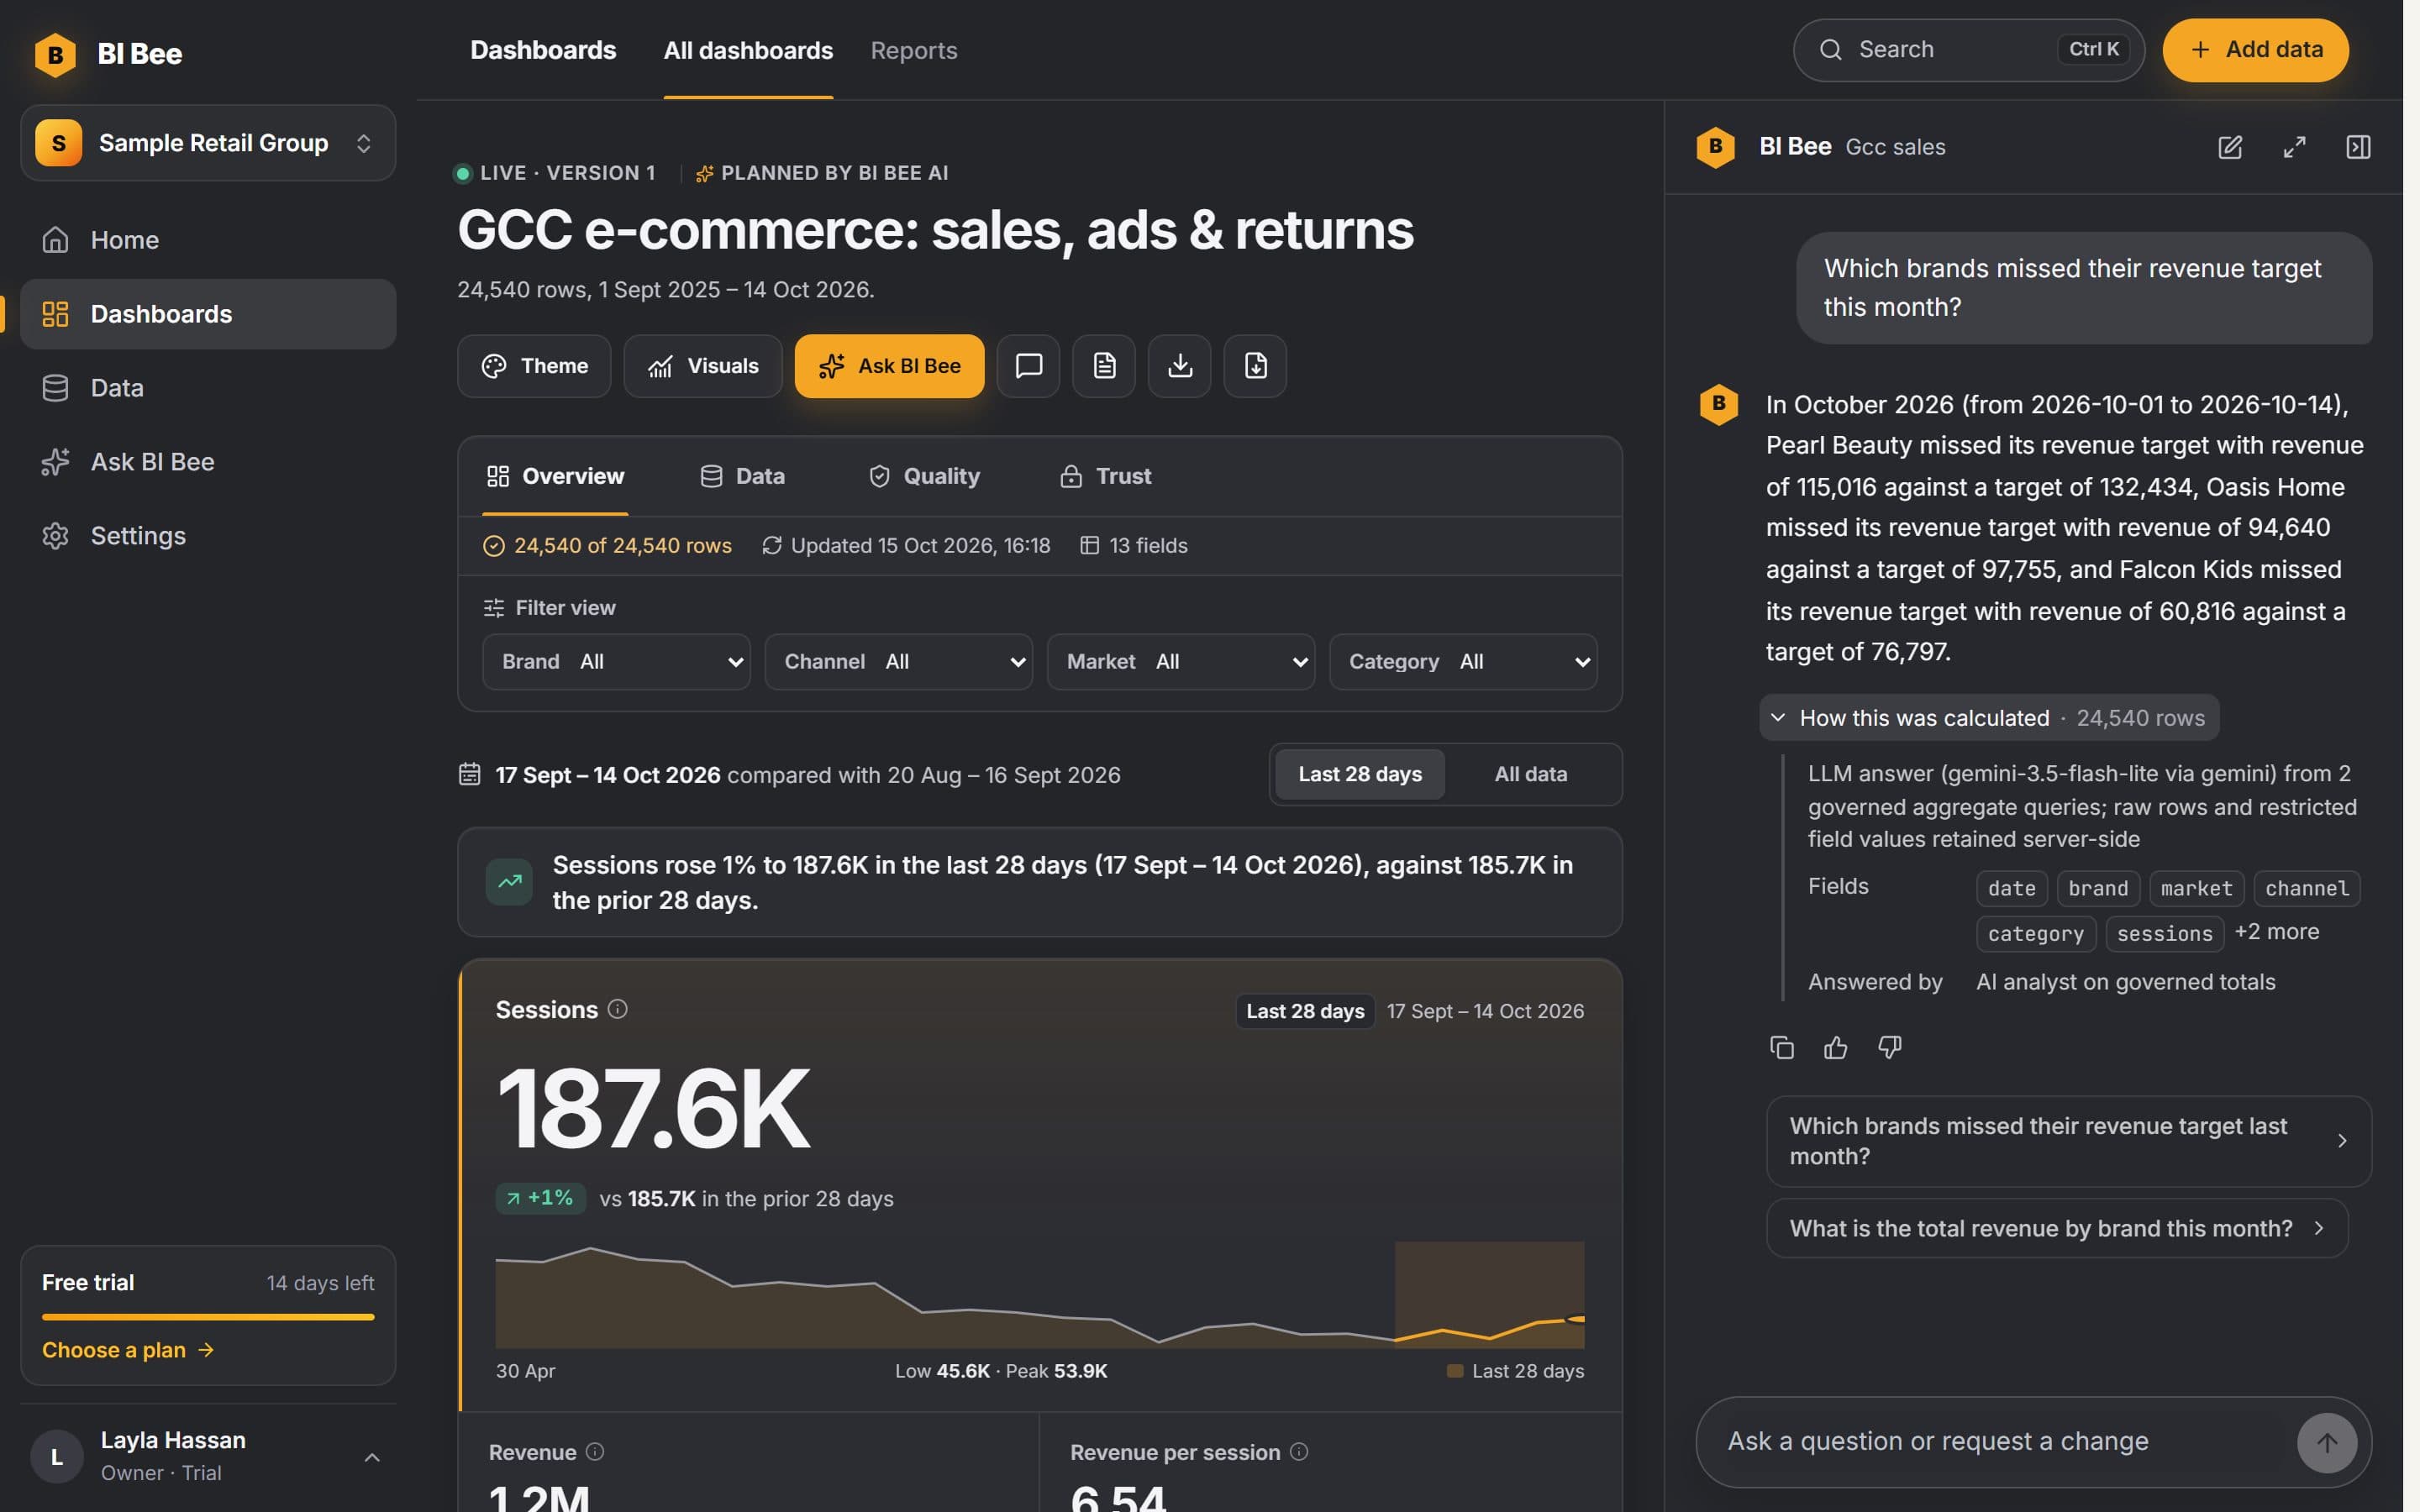
Swipe the screenshot to see the full screen.
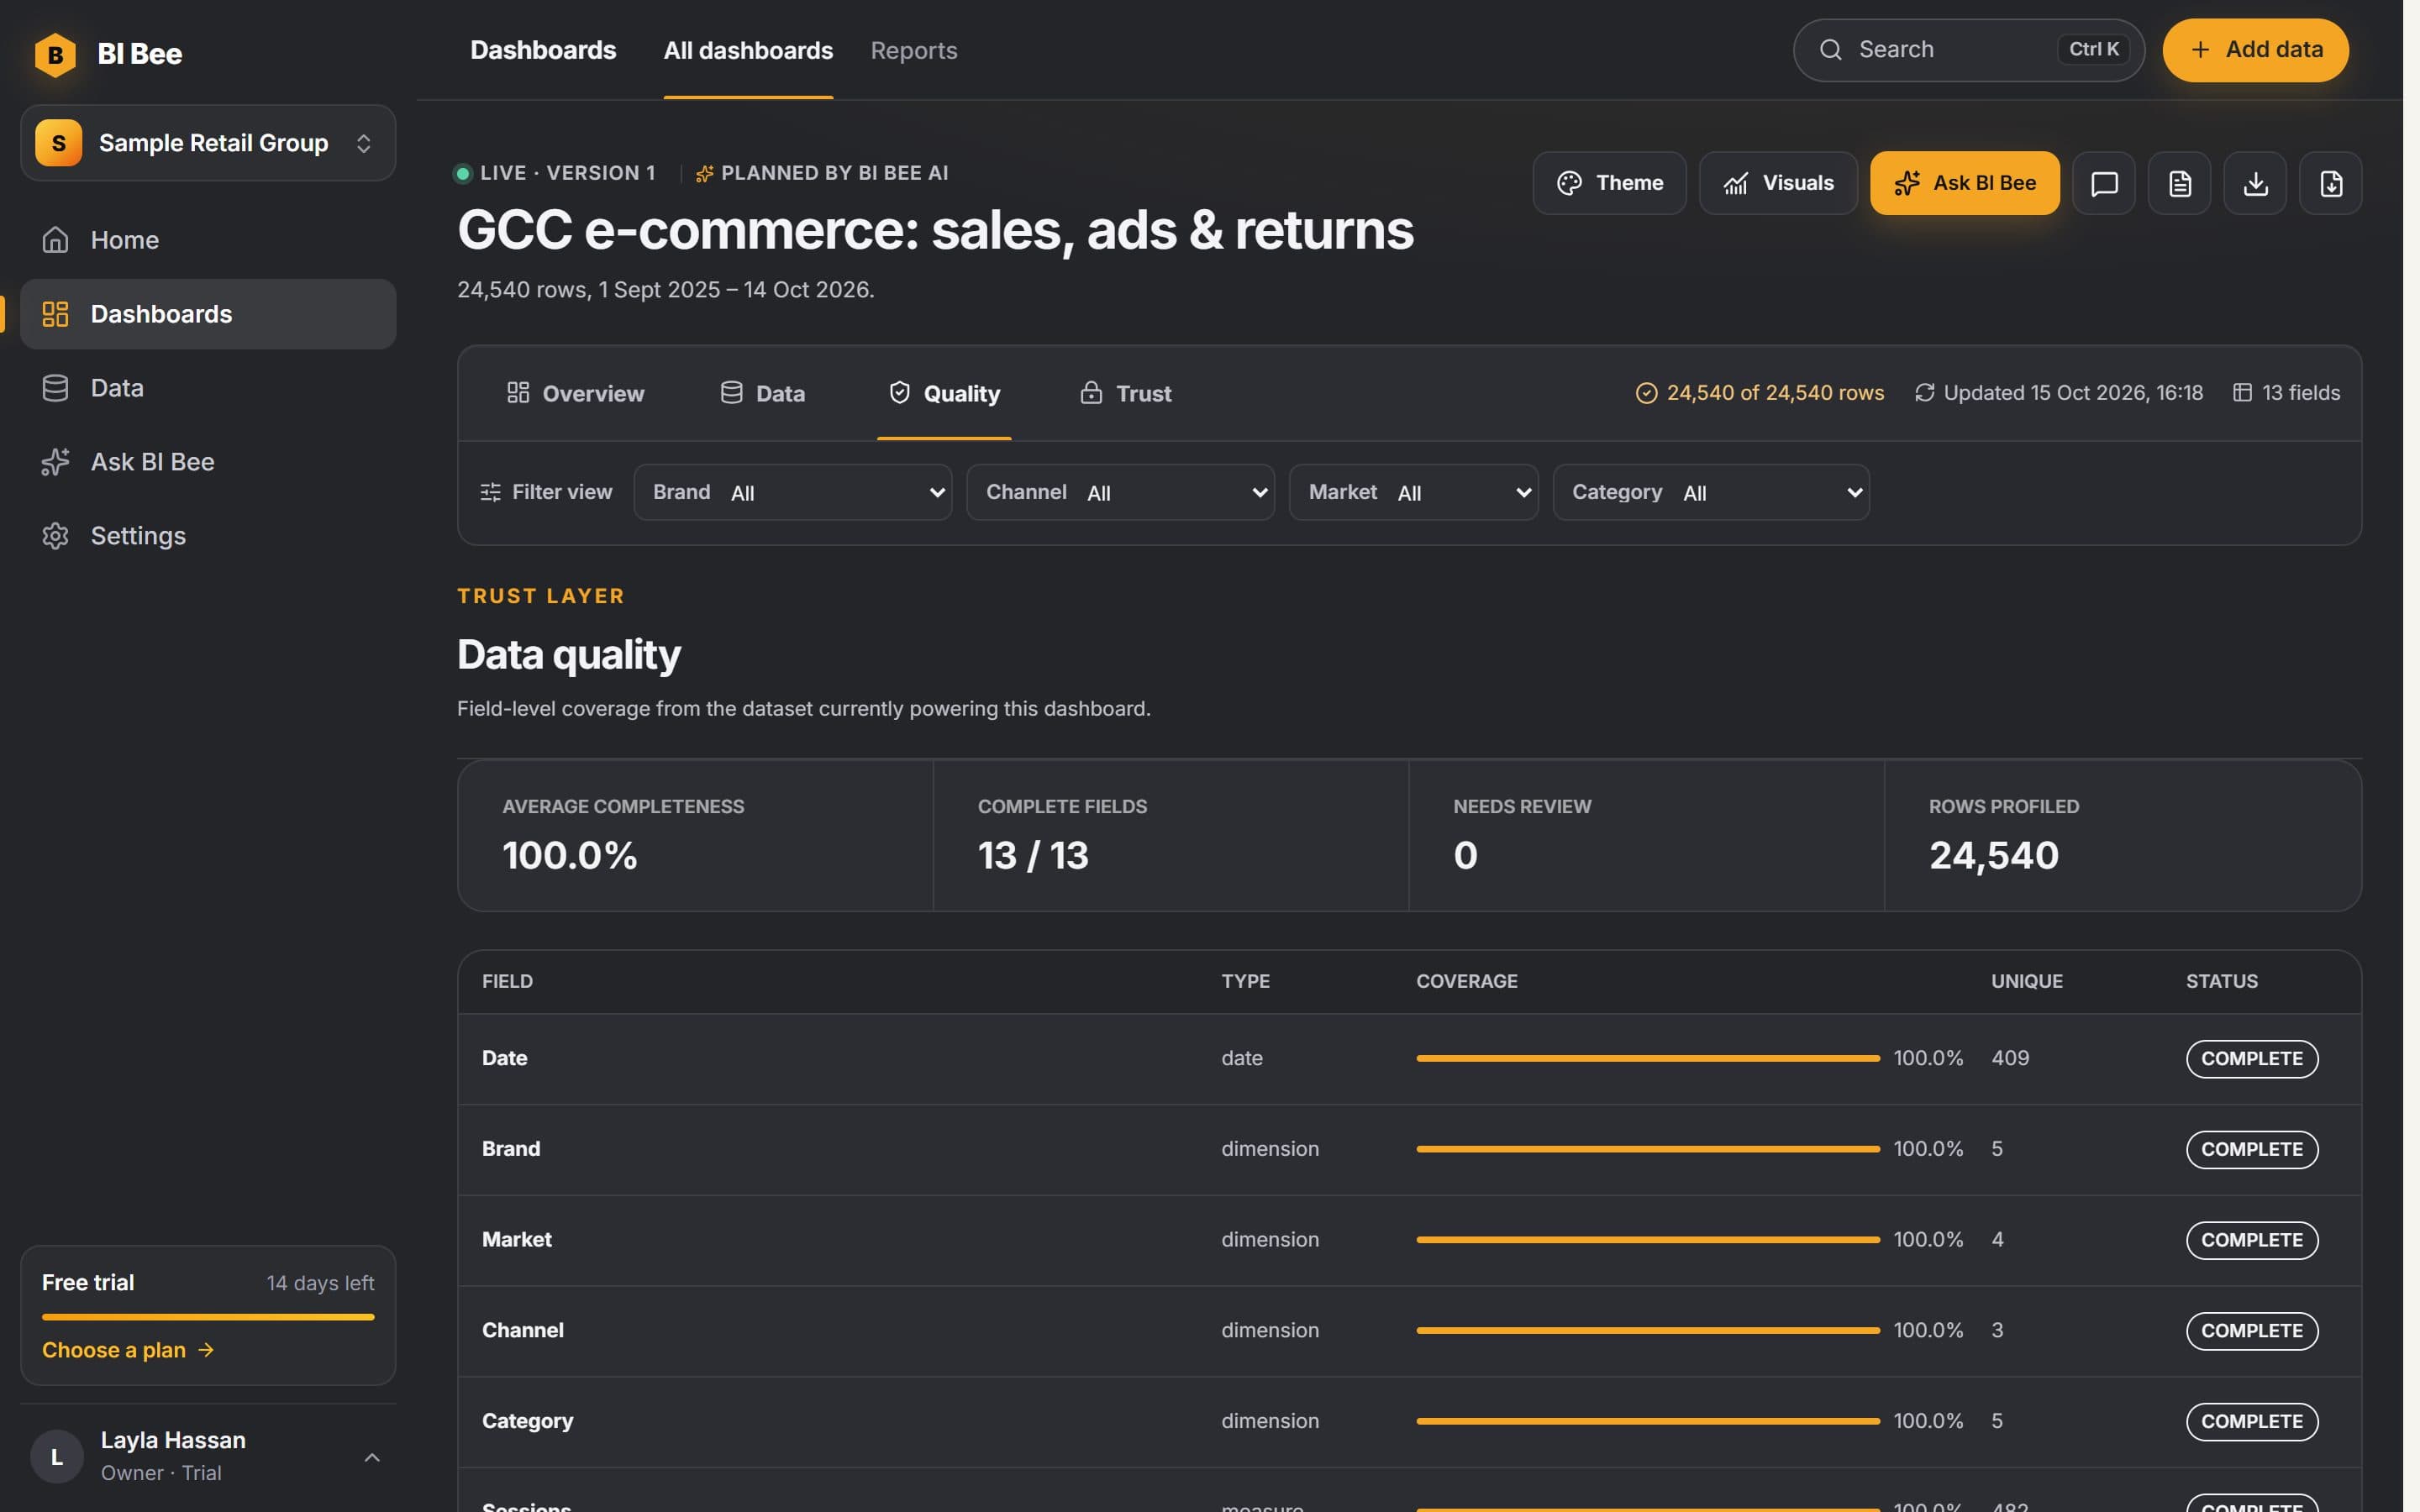
Swipe the screenshot to see the full screen.
Product
Everything below is built from the data you connect. No analyst, no SQL, no setup project.
When your data has the columns for them, the dashboard adds the analyses most tools leave to an analyst.
Write a metric such as net revenue as a simple formula. Dashboards, the analyst and AI tools all use the same definition.
Net revenue
Cohorts show how many new customers buy again, month after month.
Ask for a KPI, a chart, a filter or a new theme and the dashboard changes. Every change can be undone.
Add return on ad spend as a KPI
Added KPI “Return on ad spend”.
Show revenue by market as a bar chart
Added “Revenue by market”. Undo
Product pairs bought together, and how much more often than chance.
Schedule a weekly or monthly email with a link to a one-page analyst brief, and get an alert when a number crosses your line.
Revenue +6.2% week on week. Dune Sport led. Falcon Kids is furthest below target.
Visuals use sample data for fictional brands.
Who it's for
Sales and customers by brand and market, and what changed since last period.
Channels, return on ad spend and where shoppers drop out before they buy.
Targets, scheduled reports and alerts, without asking anyone for a spreadsheet.
Warehouse data in, metrics defined once, answers from Claude or Cursor.
AI tools
Connect BI Bee to Claude, Cursor or another MCP client and ask about your data where you already work.
claude mcp add --transport http bi-bee https://bi-bee.vercel.app/api/mcp --header "Authorization: Bearer <your token>"
Which market grew fastest this month?
Kuwait grew fastest, up 5.6% on the same days last month. UAE changed least, at +2.1%.
Who builds it
HYVE Labs is a software and AI team in Dubai. Our leadership brings more than 15 years in GCC retail, CRM and growth, and that experience shapes what BI Bee measures first.
Meet HYVE LabsSecurity
Everyone sees what their role allows, on dashboards, in exports and in the analyst. Pick a role to see what opens.
Read how security worksEvery query is limited to your own workspace. Data is never shared across customers.
Passwords and API keys for your sources are encrypted with AES-256-GCM and never sent back to the browser.
Owner, admin, analyst and viewer. The server checks the role on every change, not just the screen.
Email, phone, name and address columns are marked personal on import. You can change any column.
On by default for new workspaces; owners and admins can switch it off. It never receives raw rows.
Claude and Cursor connect with read-only personal tokens that owners and admins can revoke.
Sign-ins, uploads, syncs, dashboard changes and AI tool calls are logged for admins to review.
Sign-in, sign-up and API requests are rate limited to slow down guessing and abuse.
Controls implemented today, described as they work. No certification is claimed.
Pricing
Prices in US dollars. Every plan starts with a 14-day free trial with up to 50K rows, 3 sources and 2 team members. No card needed.
Self-serve
$179/ month
Billed monthly
Private workspace, connectors, dashboards, AI analyst, reports and alerts.
Growth
More volume$379/ month
Billed monthly
More volume, more sources, more team.
Not sure which plan fits? Book a demo and we will walk you through it.
FAQ
Yes, unless an owner or admin switches the external AI model off; it is on by default for new workspaces. It receives field names, summary figures such as totals and ranges, a few common category values and your question. Raw rows, and values in columns marked personal or confidential, are never sent.
No. BI Bee picks the KPIs and charts from your columns, and you change them by asking in plain English. Analysts can still add calculated metrics with a simple formula.
Connected sources can refresh daily, and you can sync any time. An uploaded file stays as it was until you upload a newer one.
Yes. Upload a CSV export, or connect any JSON API with the REST connector. Tell us what you would like connected next.
The trial runs 14 days with up to 50K rows, 3 sources and 2 team members. When it ends your data stays, and the workspace is read-only until an owner or admin picks a plan.
HYVE Labs, a software and AI team in Dubai. You can talk to the people who build it on a demo call or on WhatsApp.
Your first dashboard is one upload away
Start free for 14 days, or see BI Bee on your own data on a short call.